Help tell the story in the data.
•OBJECTIVE
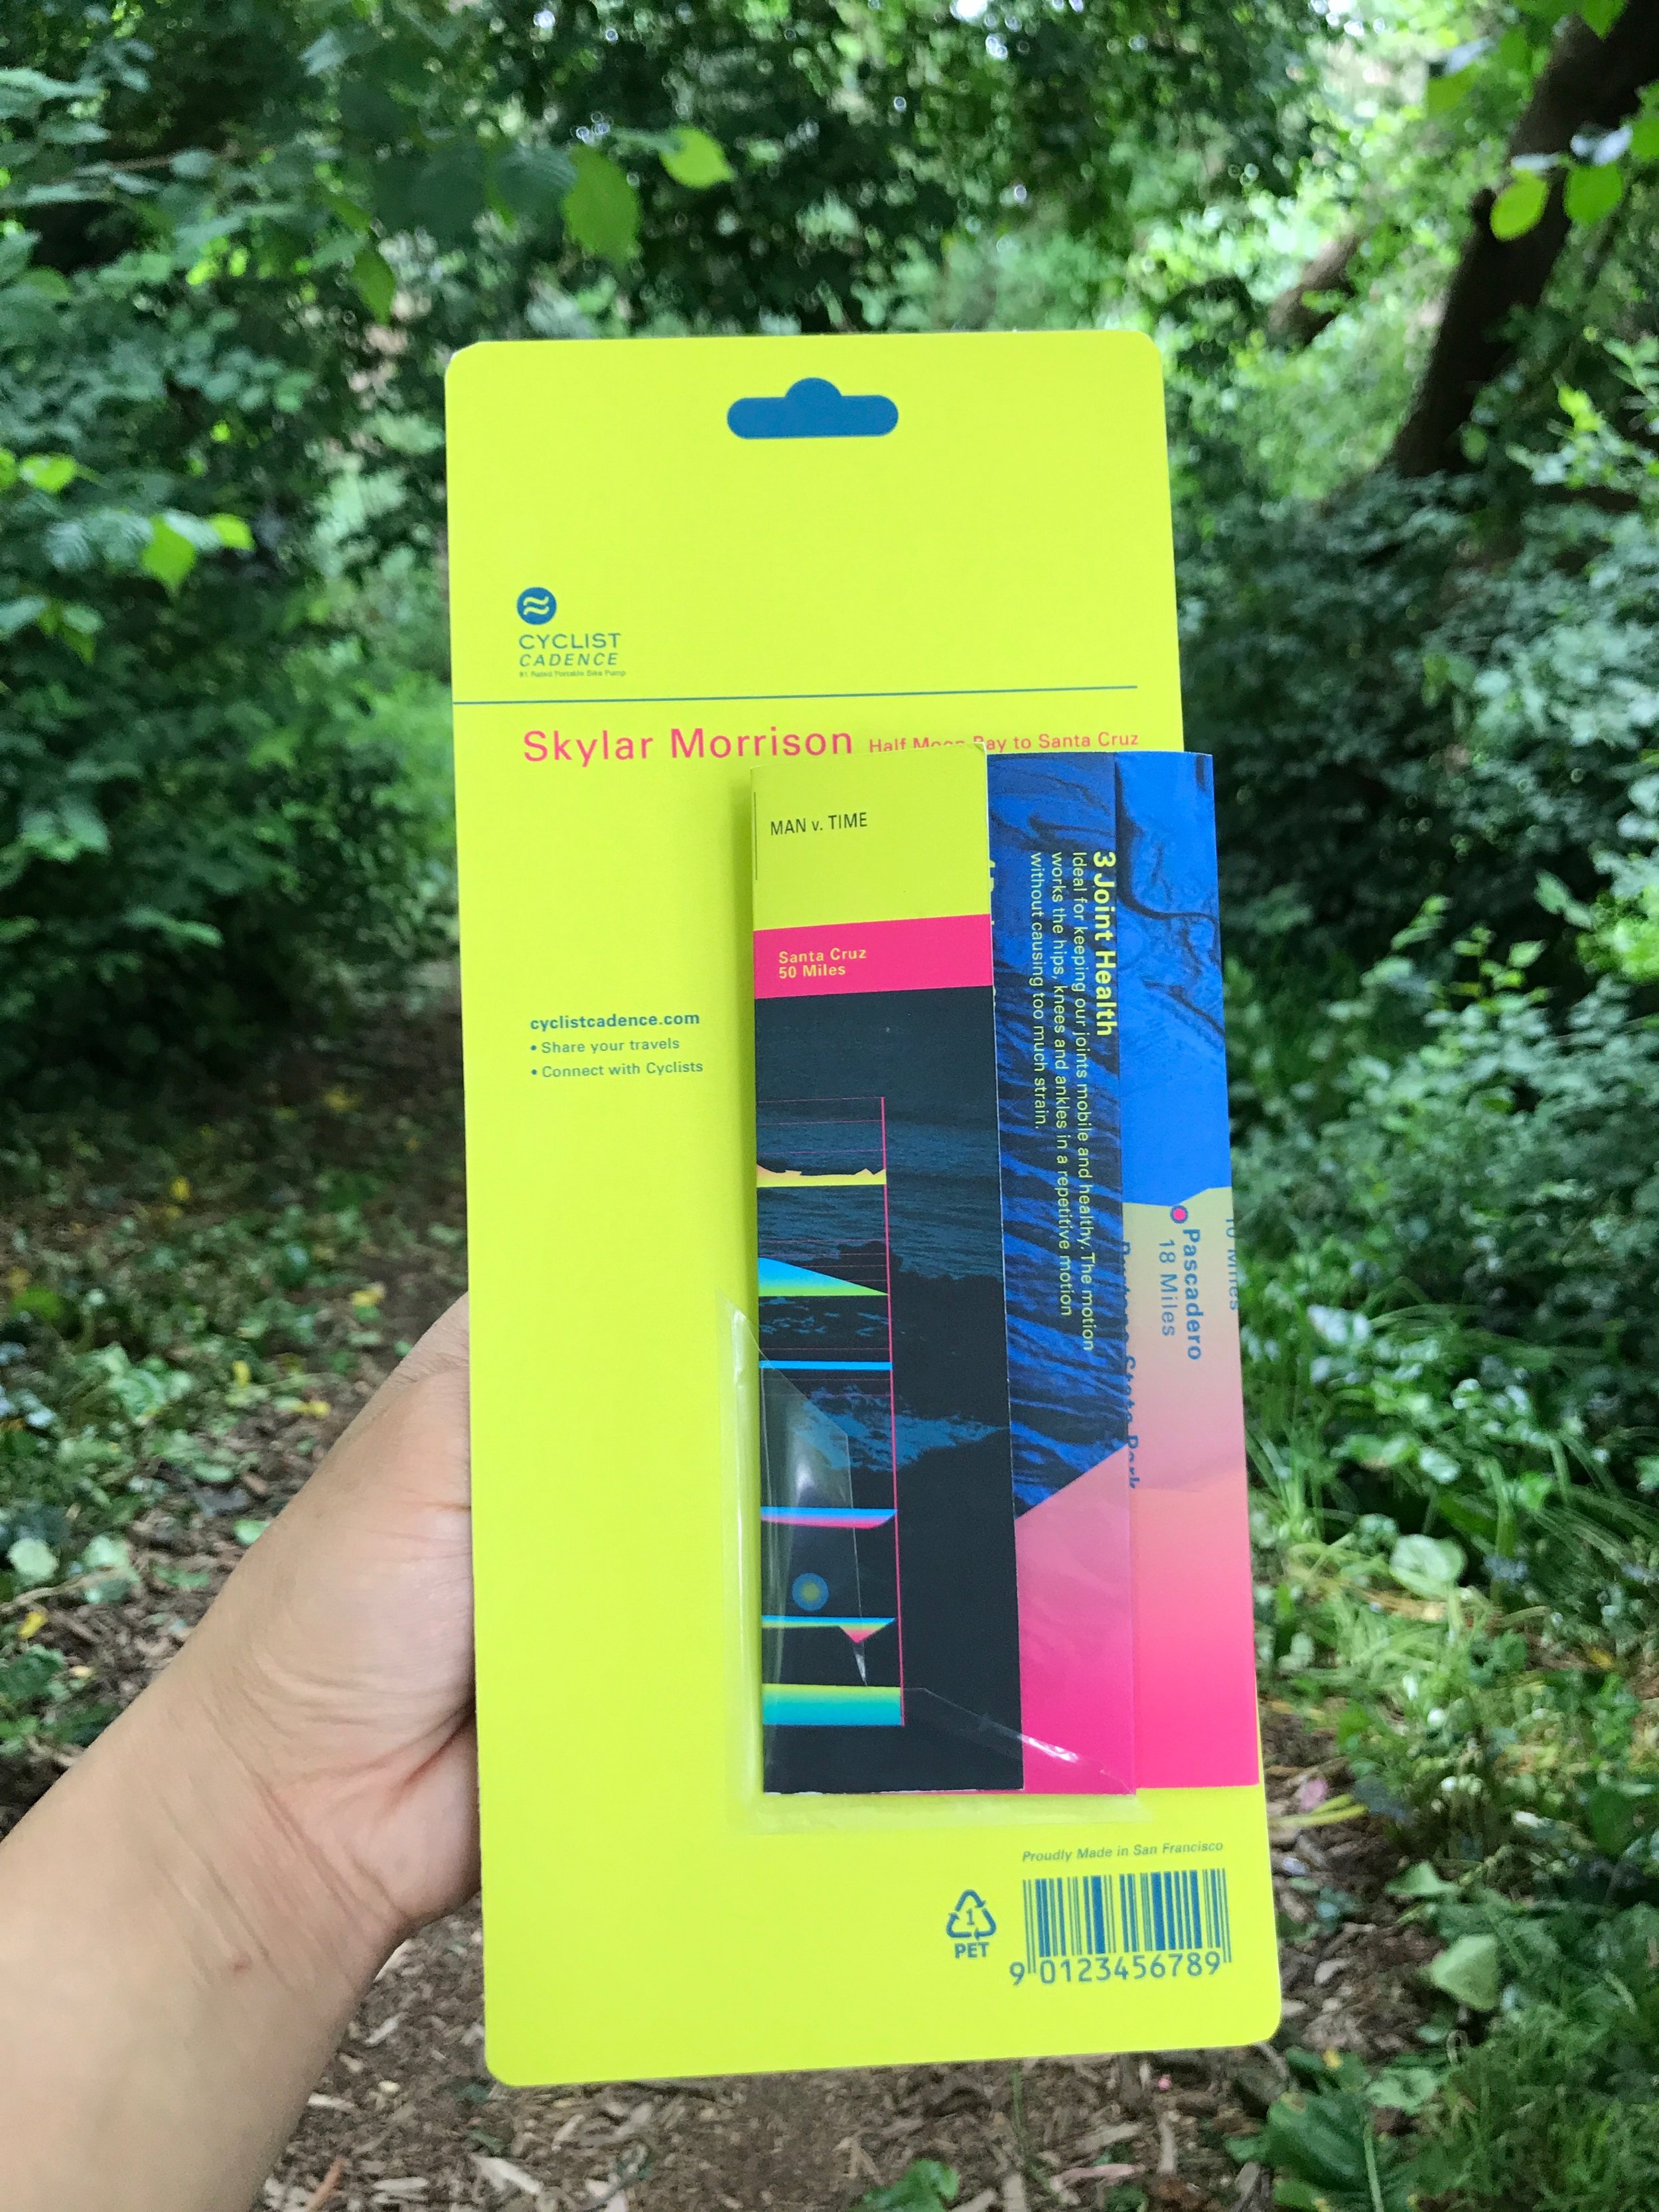
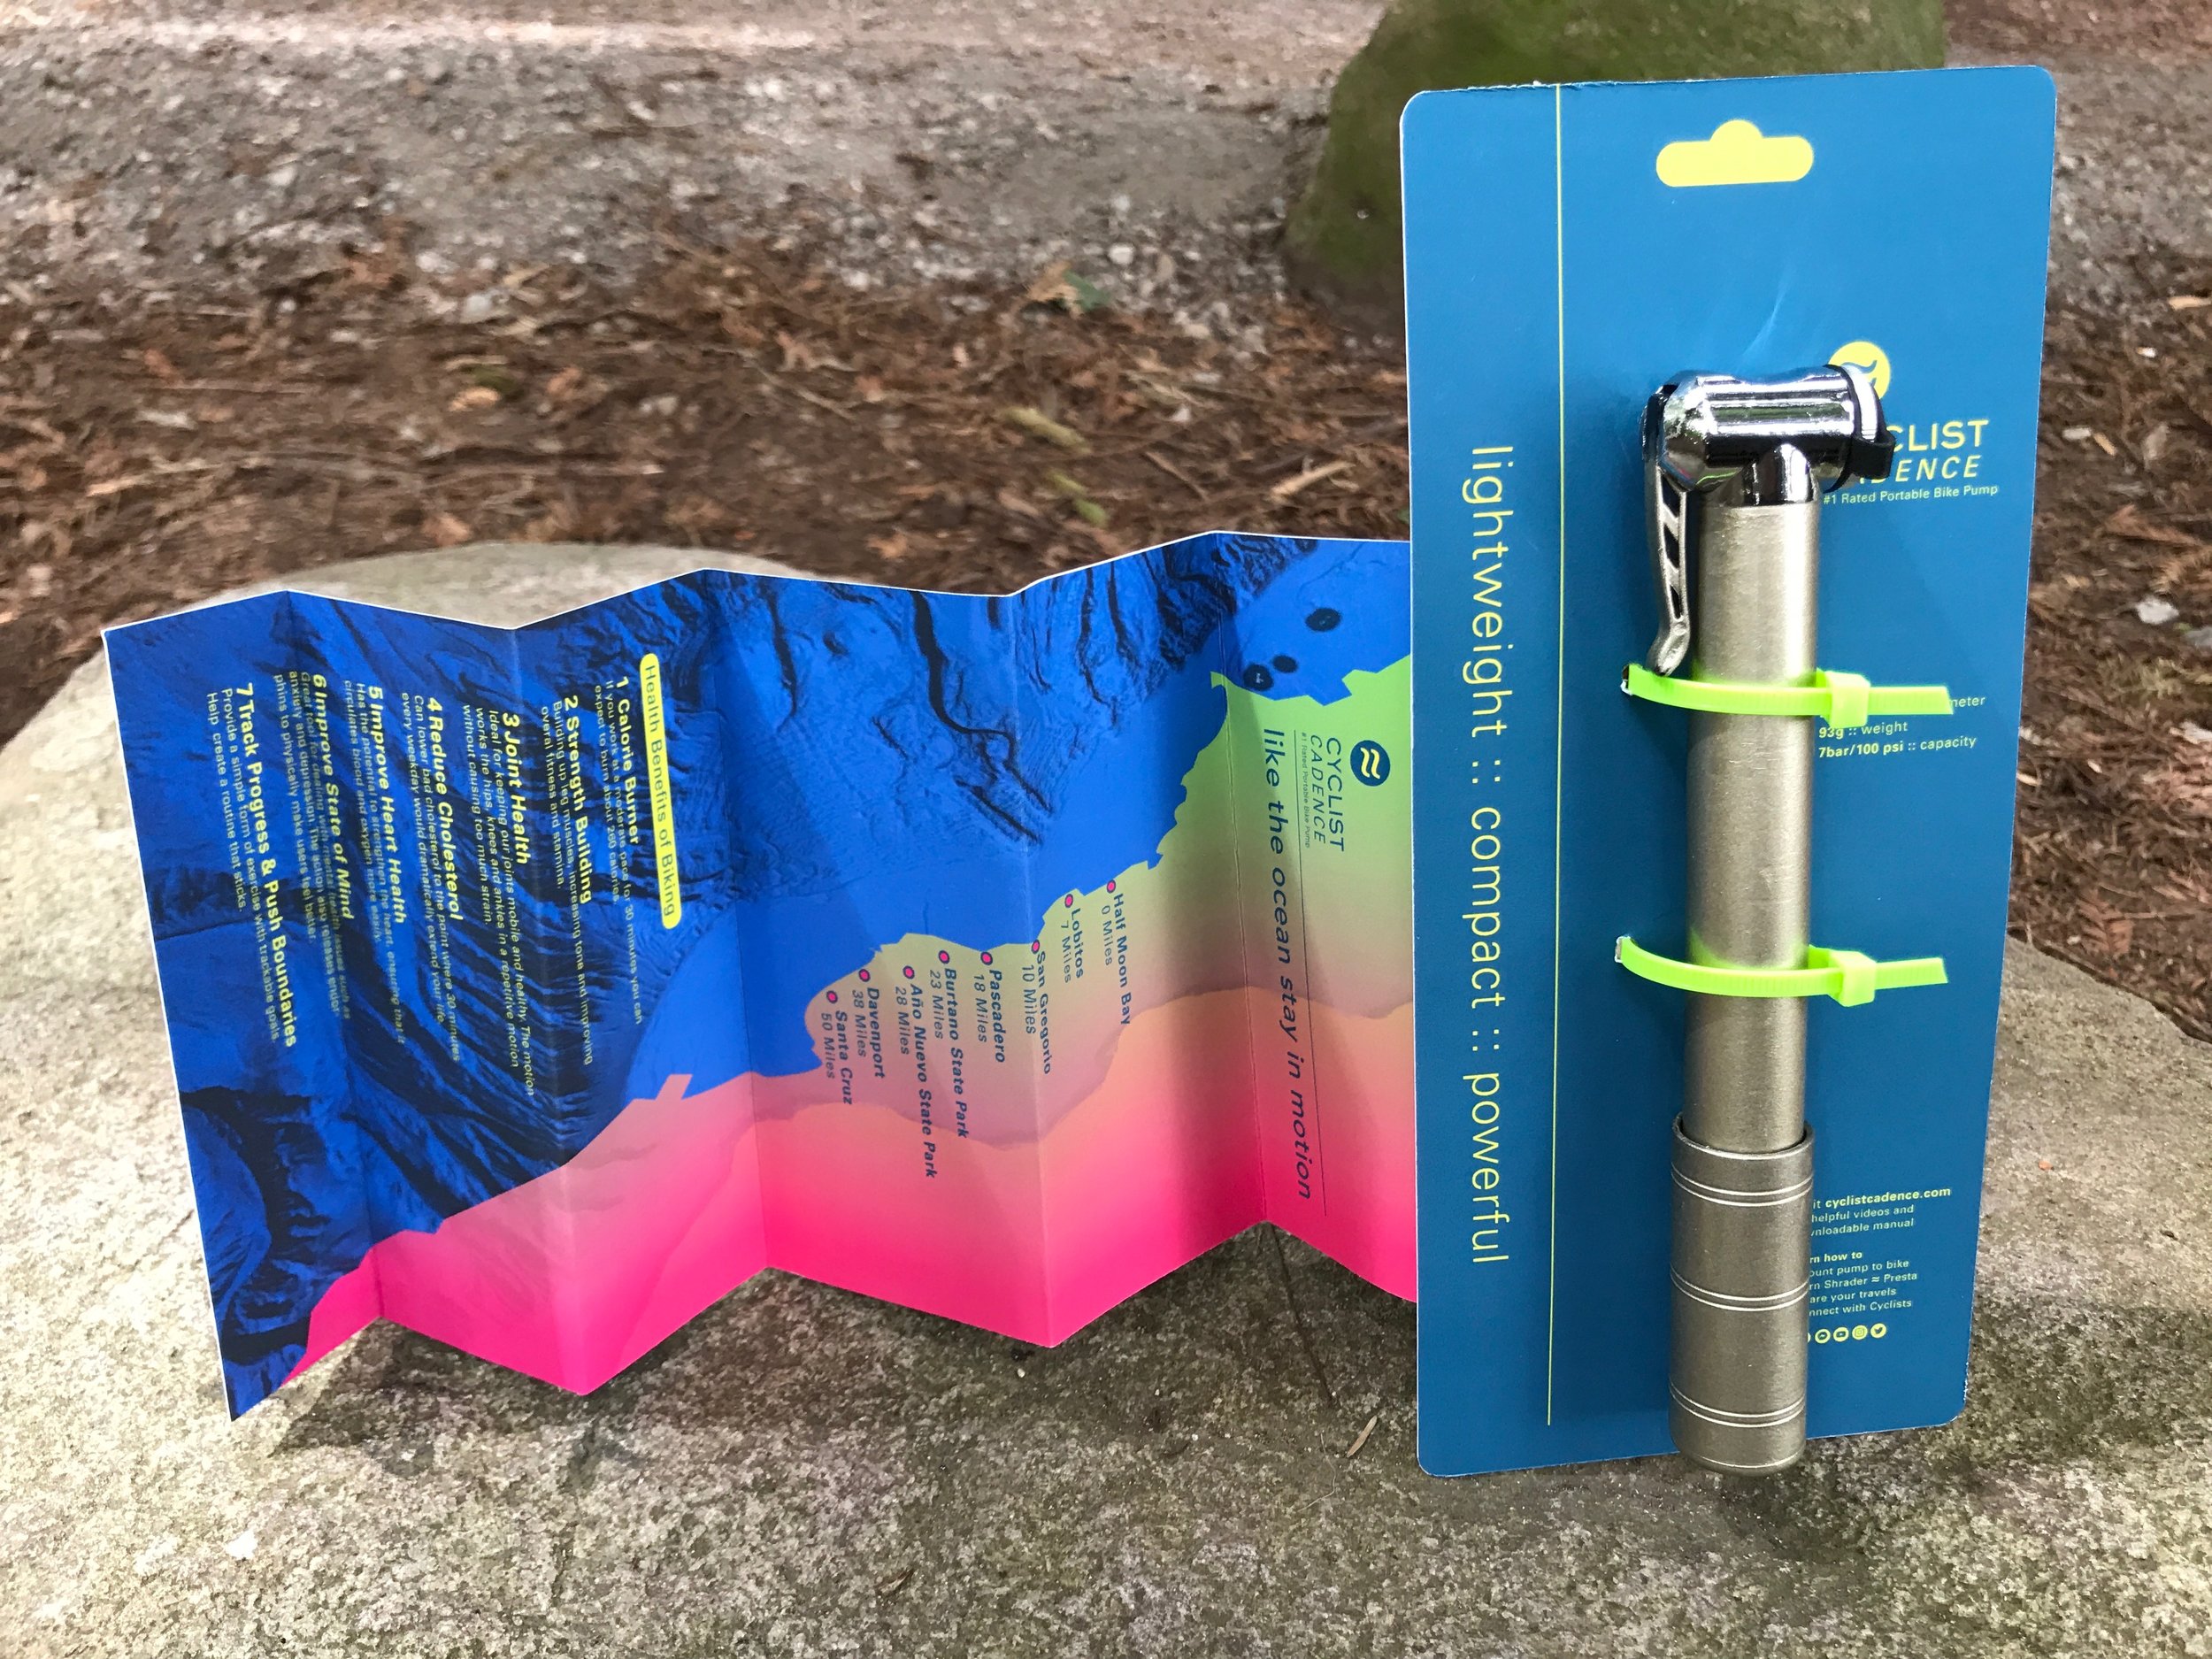
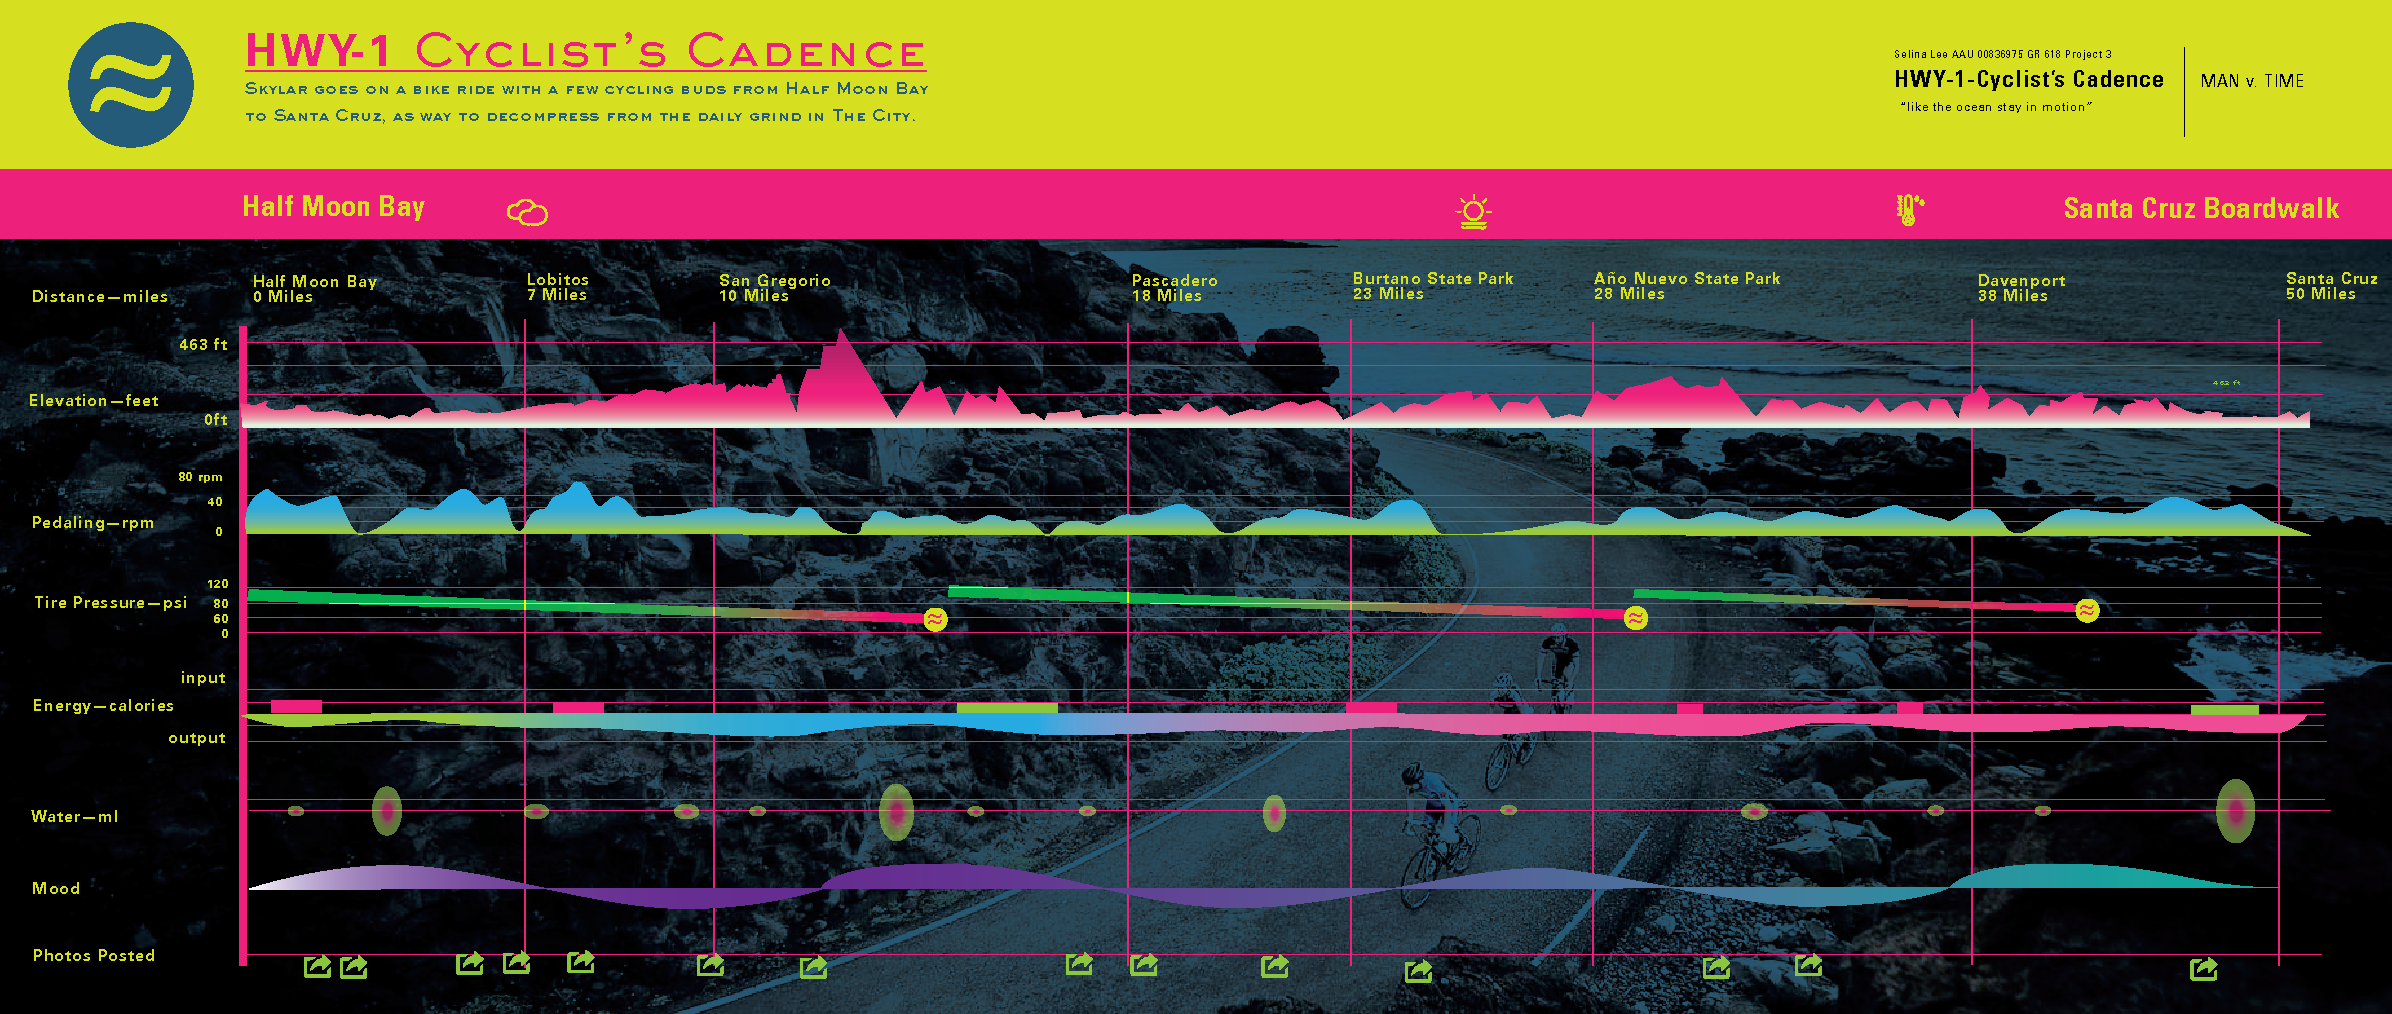
Create an infographic timeline about an event based on man versus time, using non-typical units of measurement.
•CATEGORY product design/infographic
•MY ROLE concept/strategy/visual

•STRATEGY
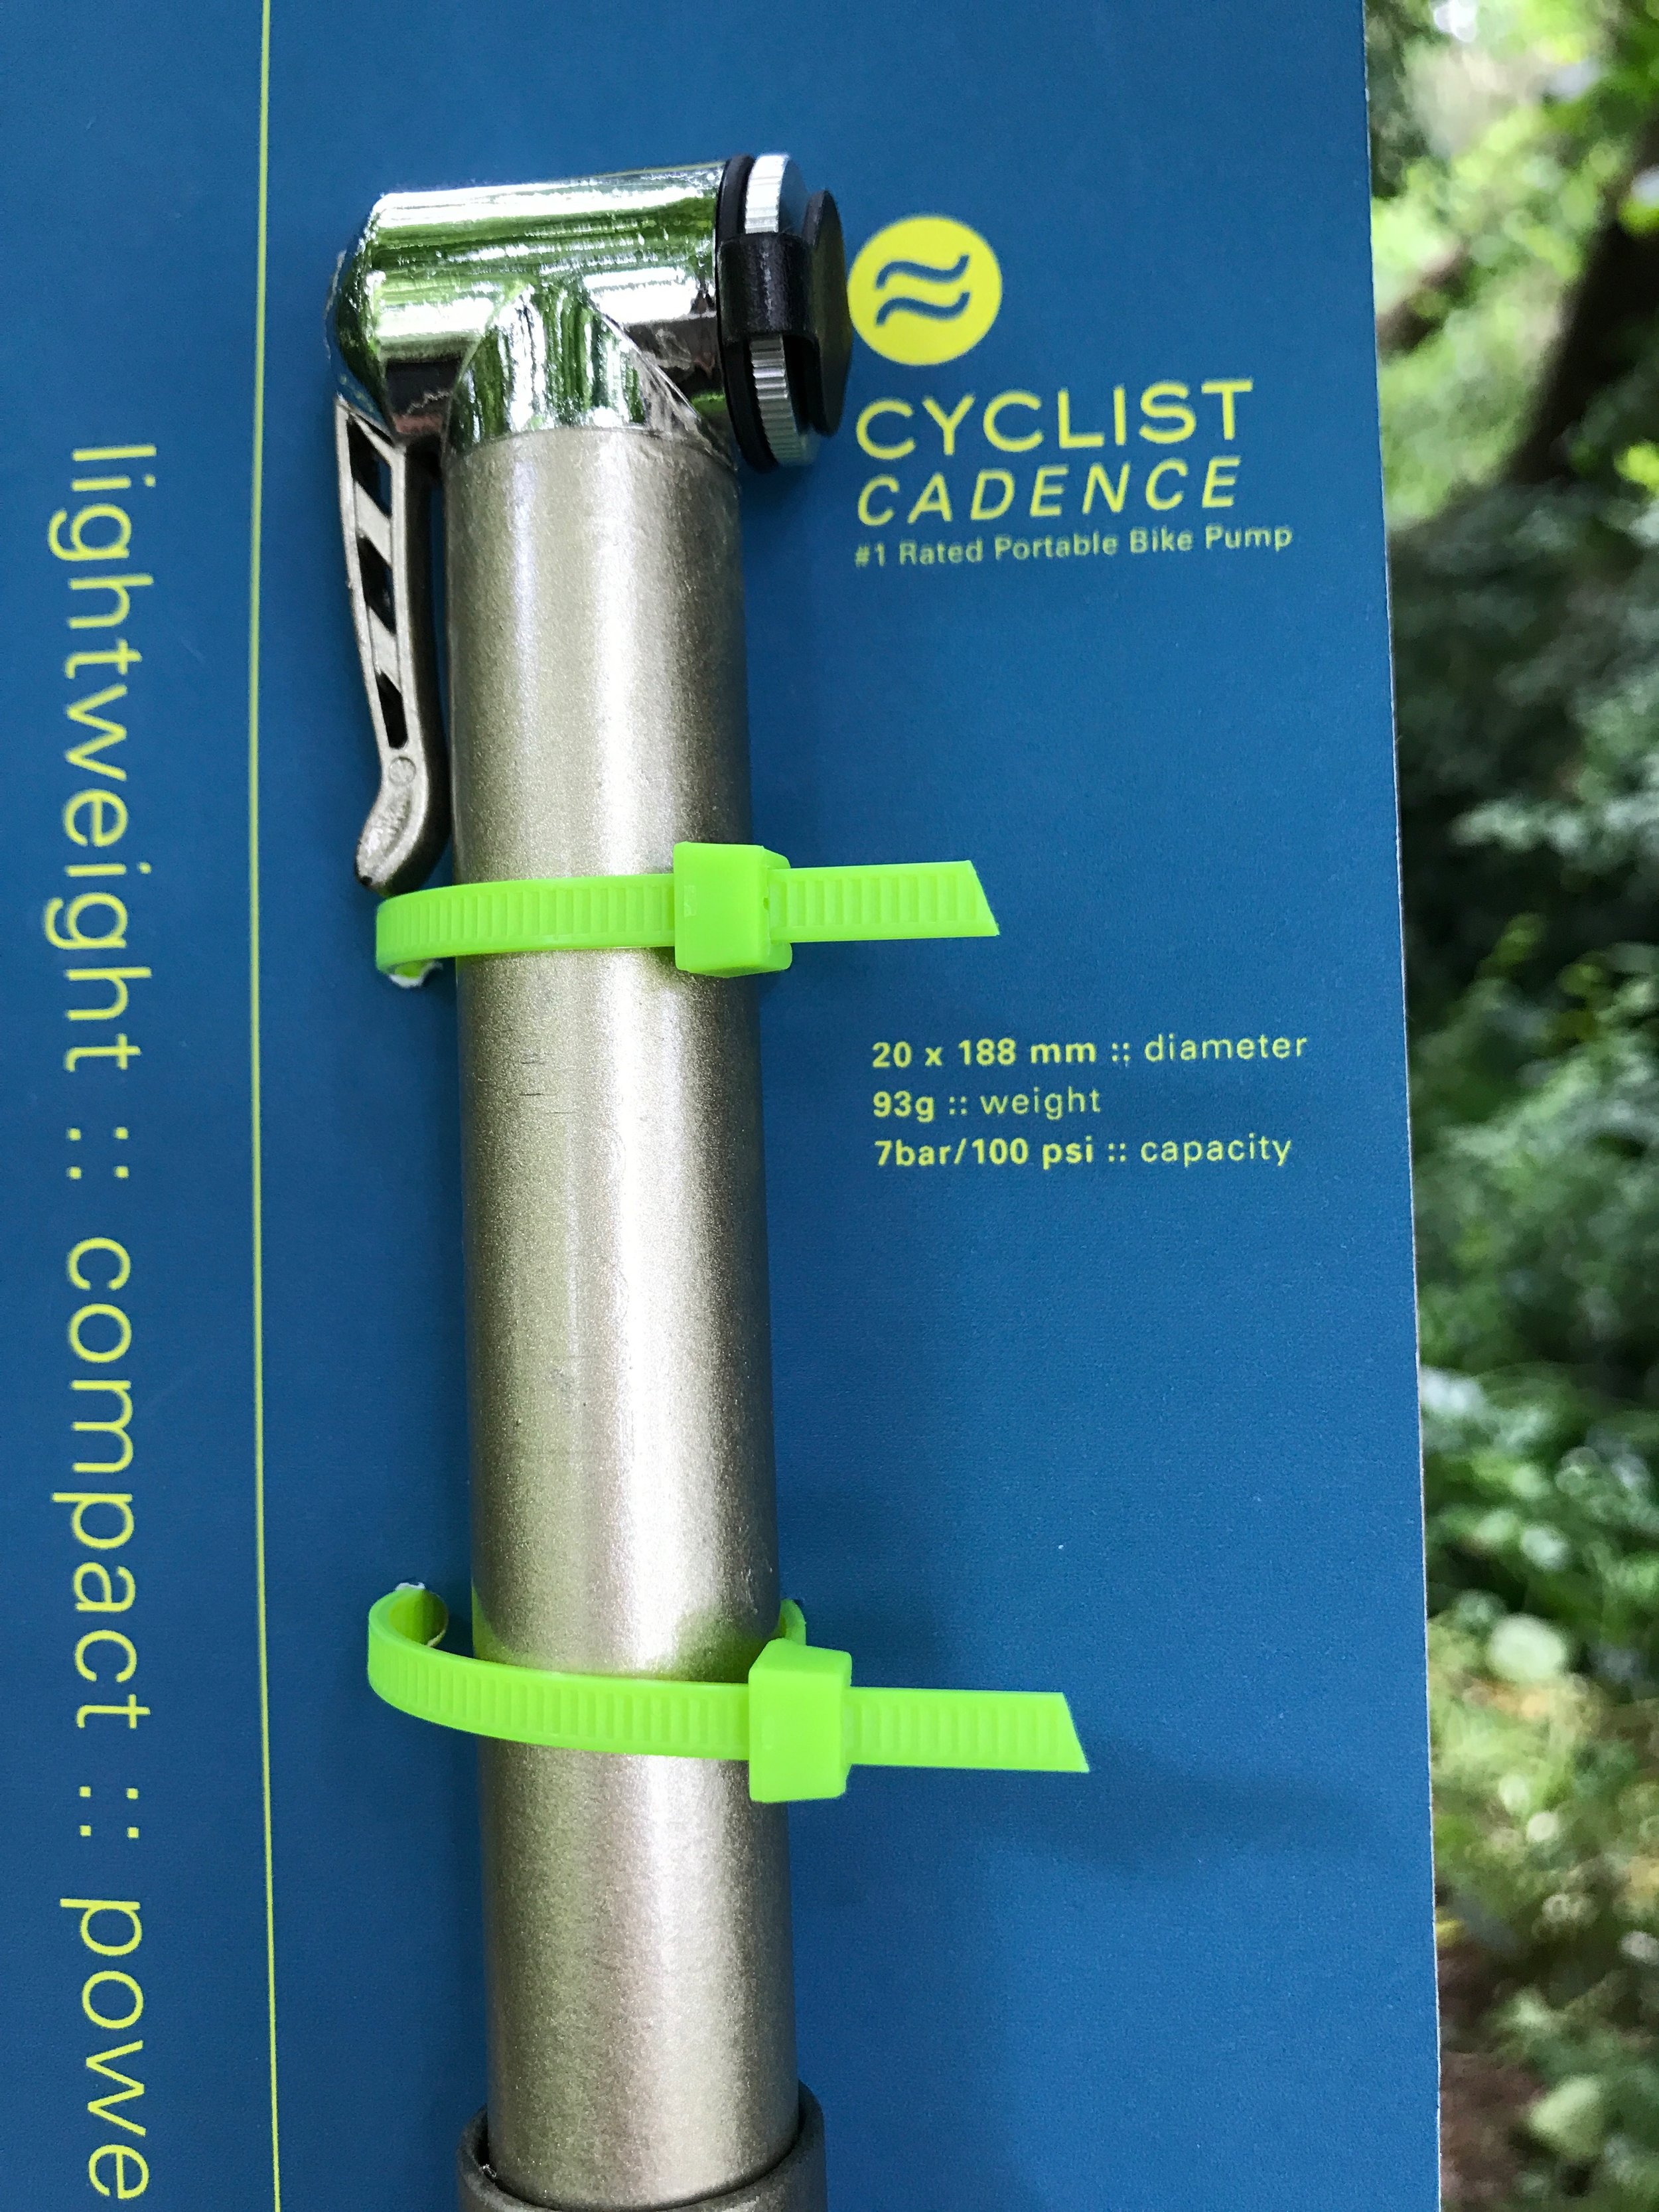
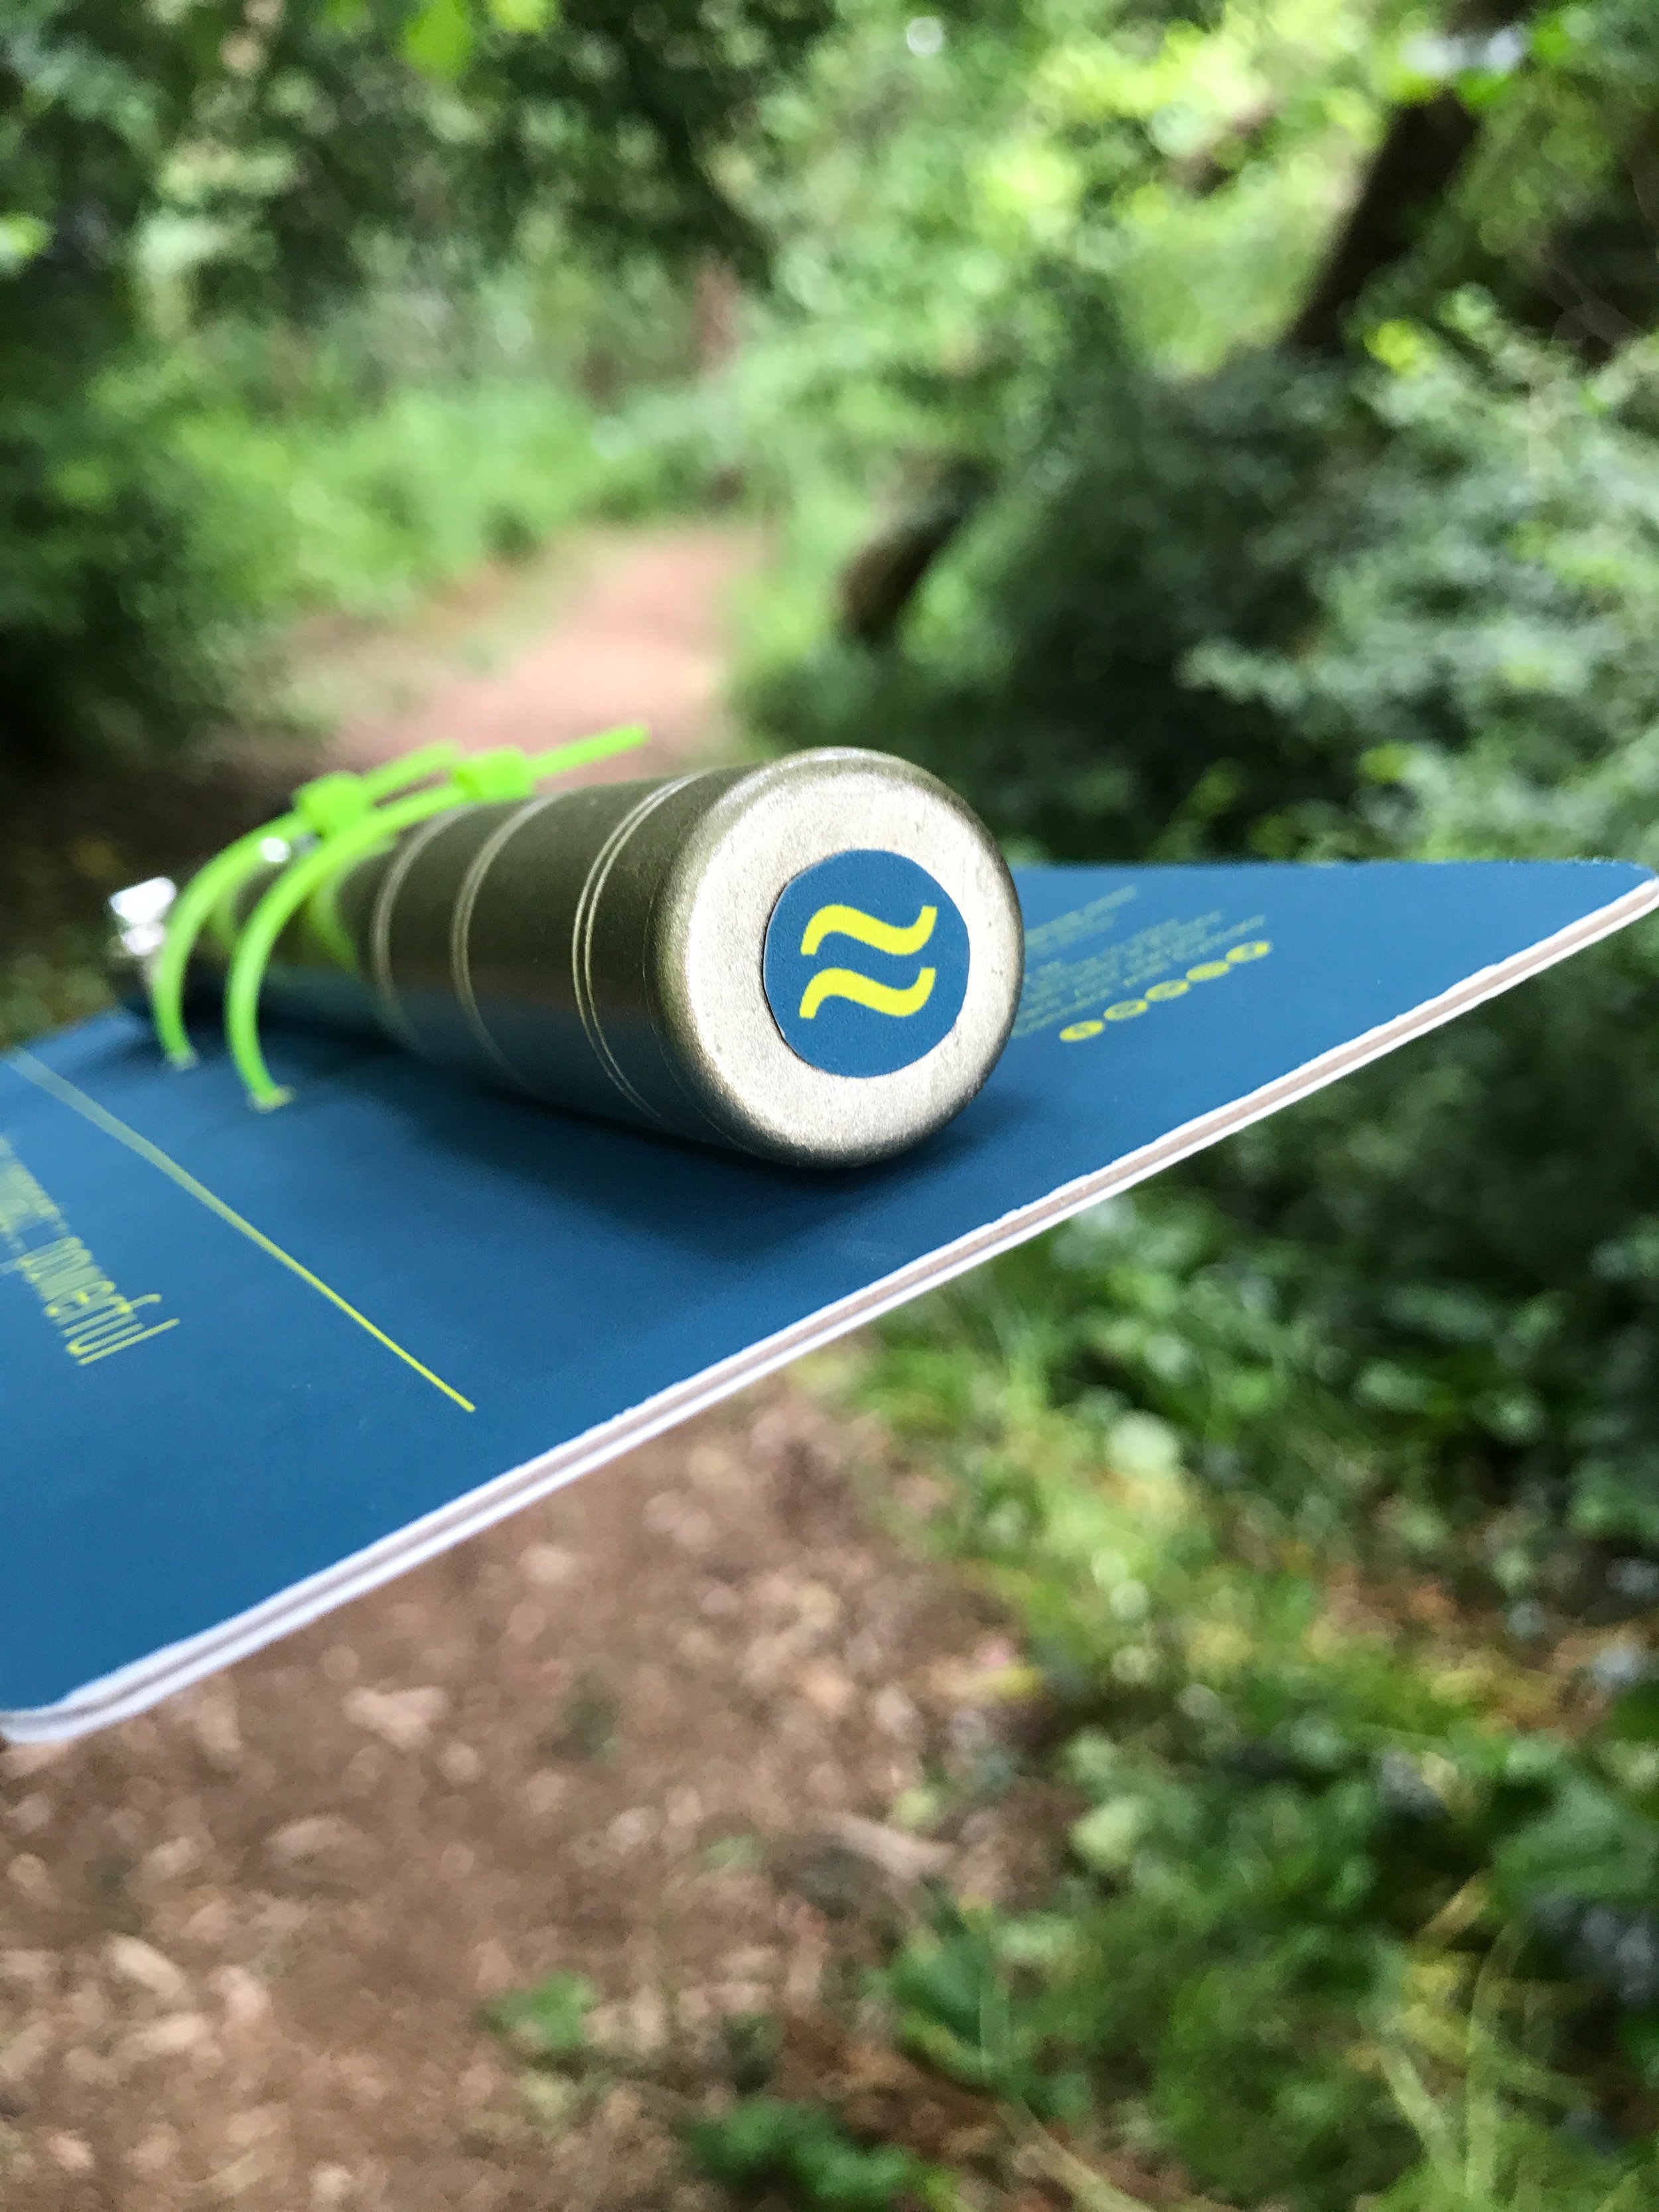
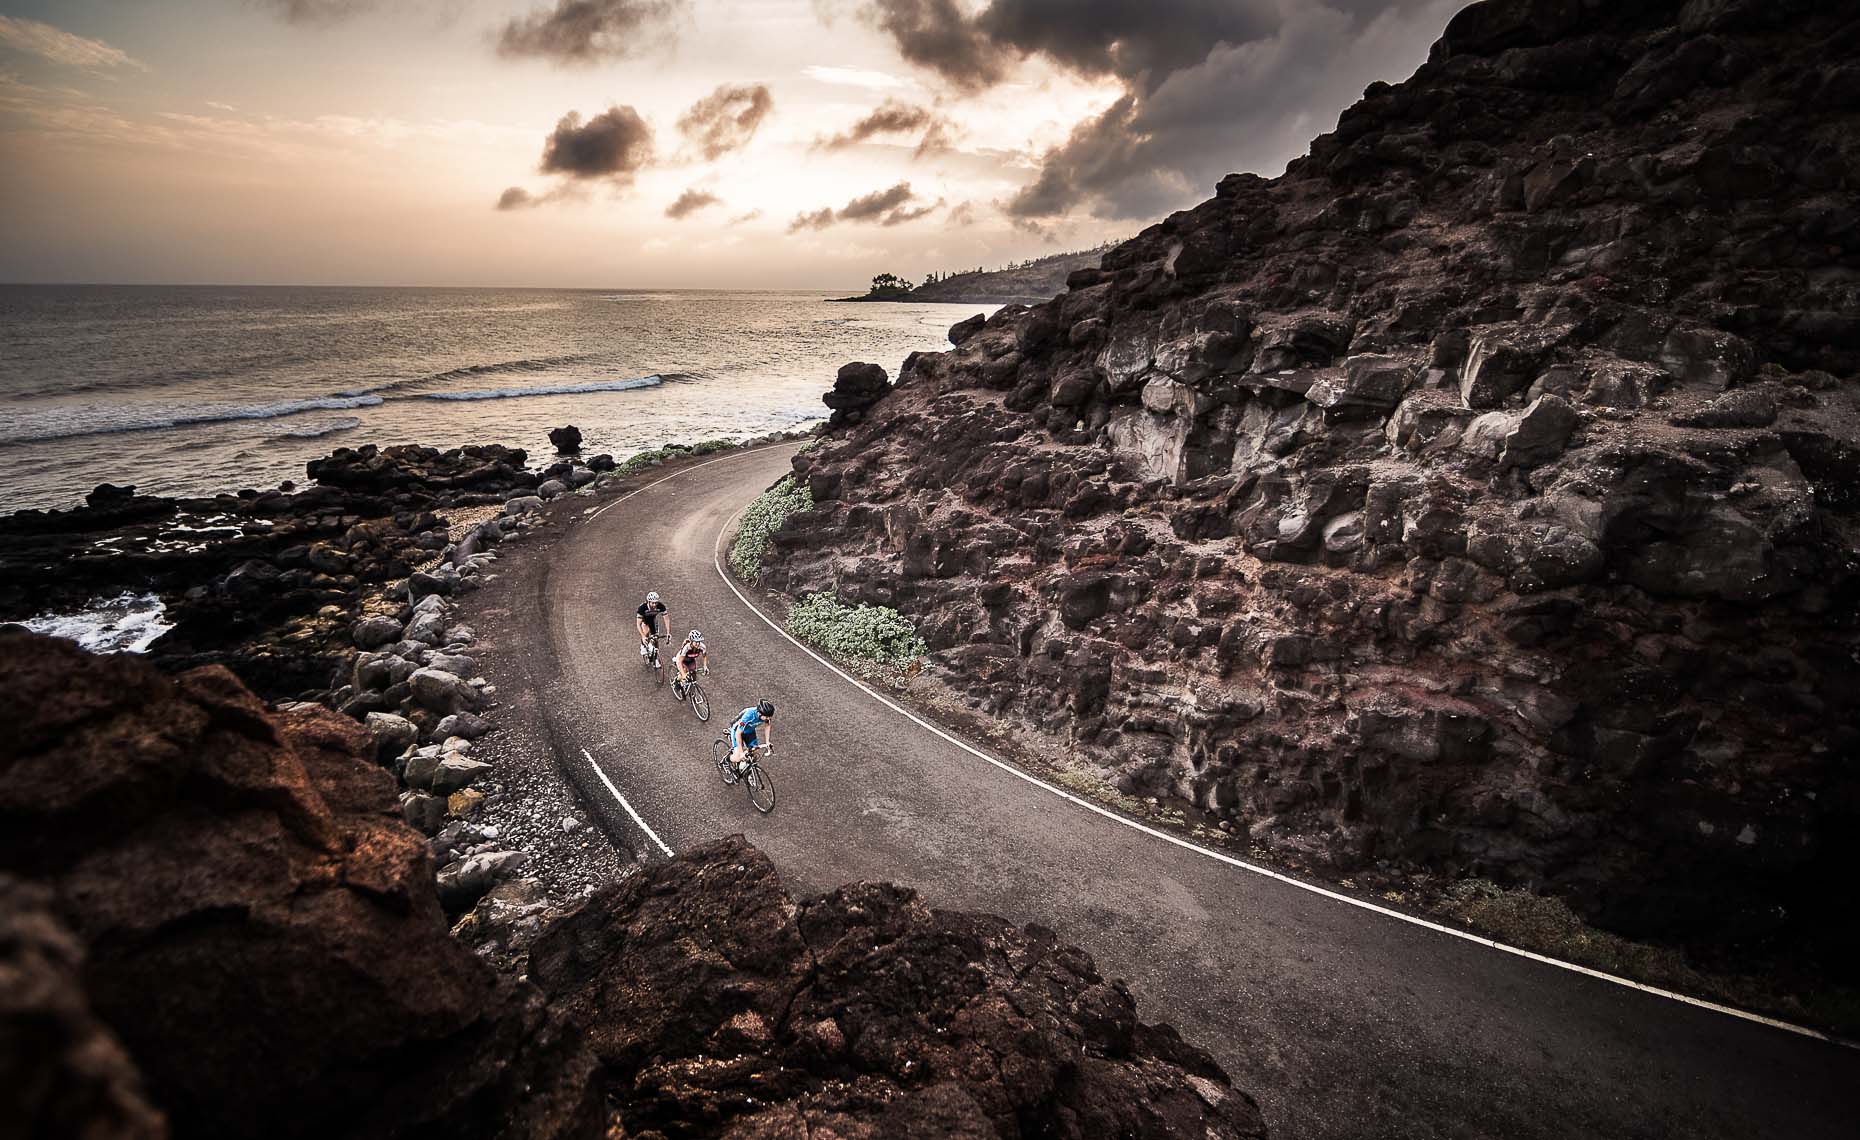
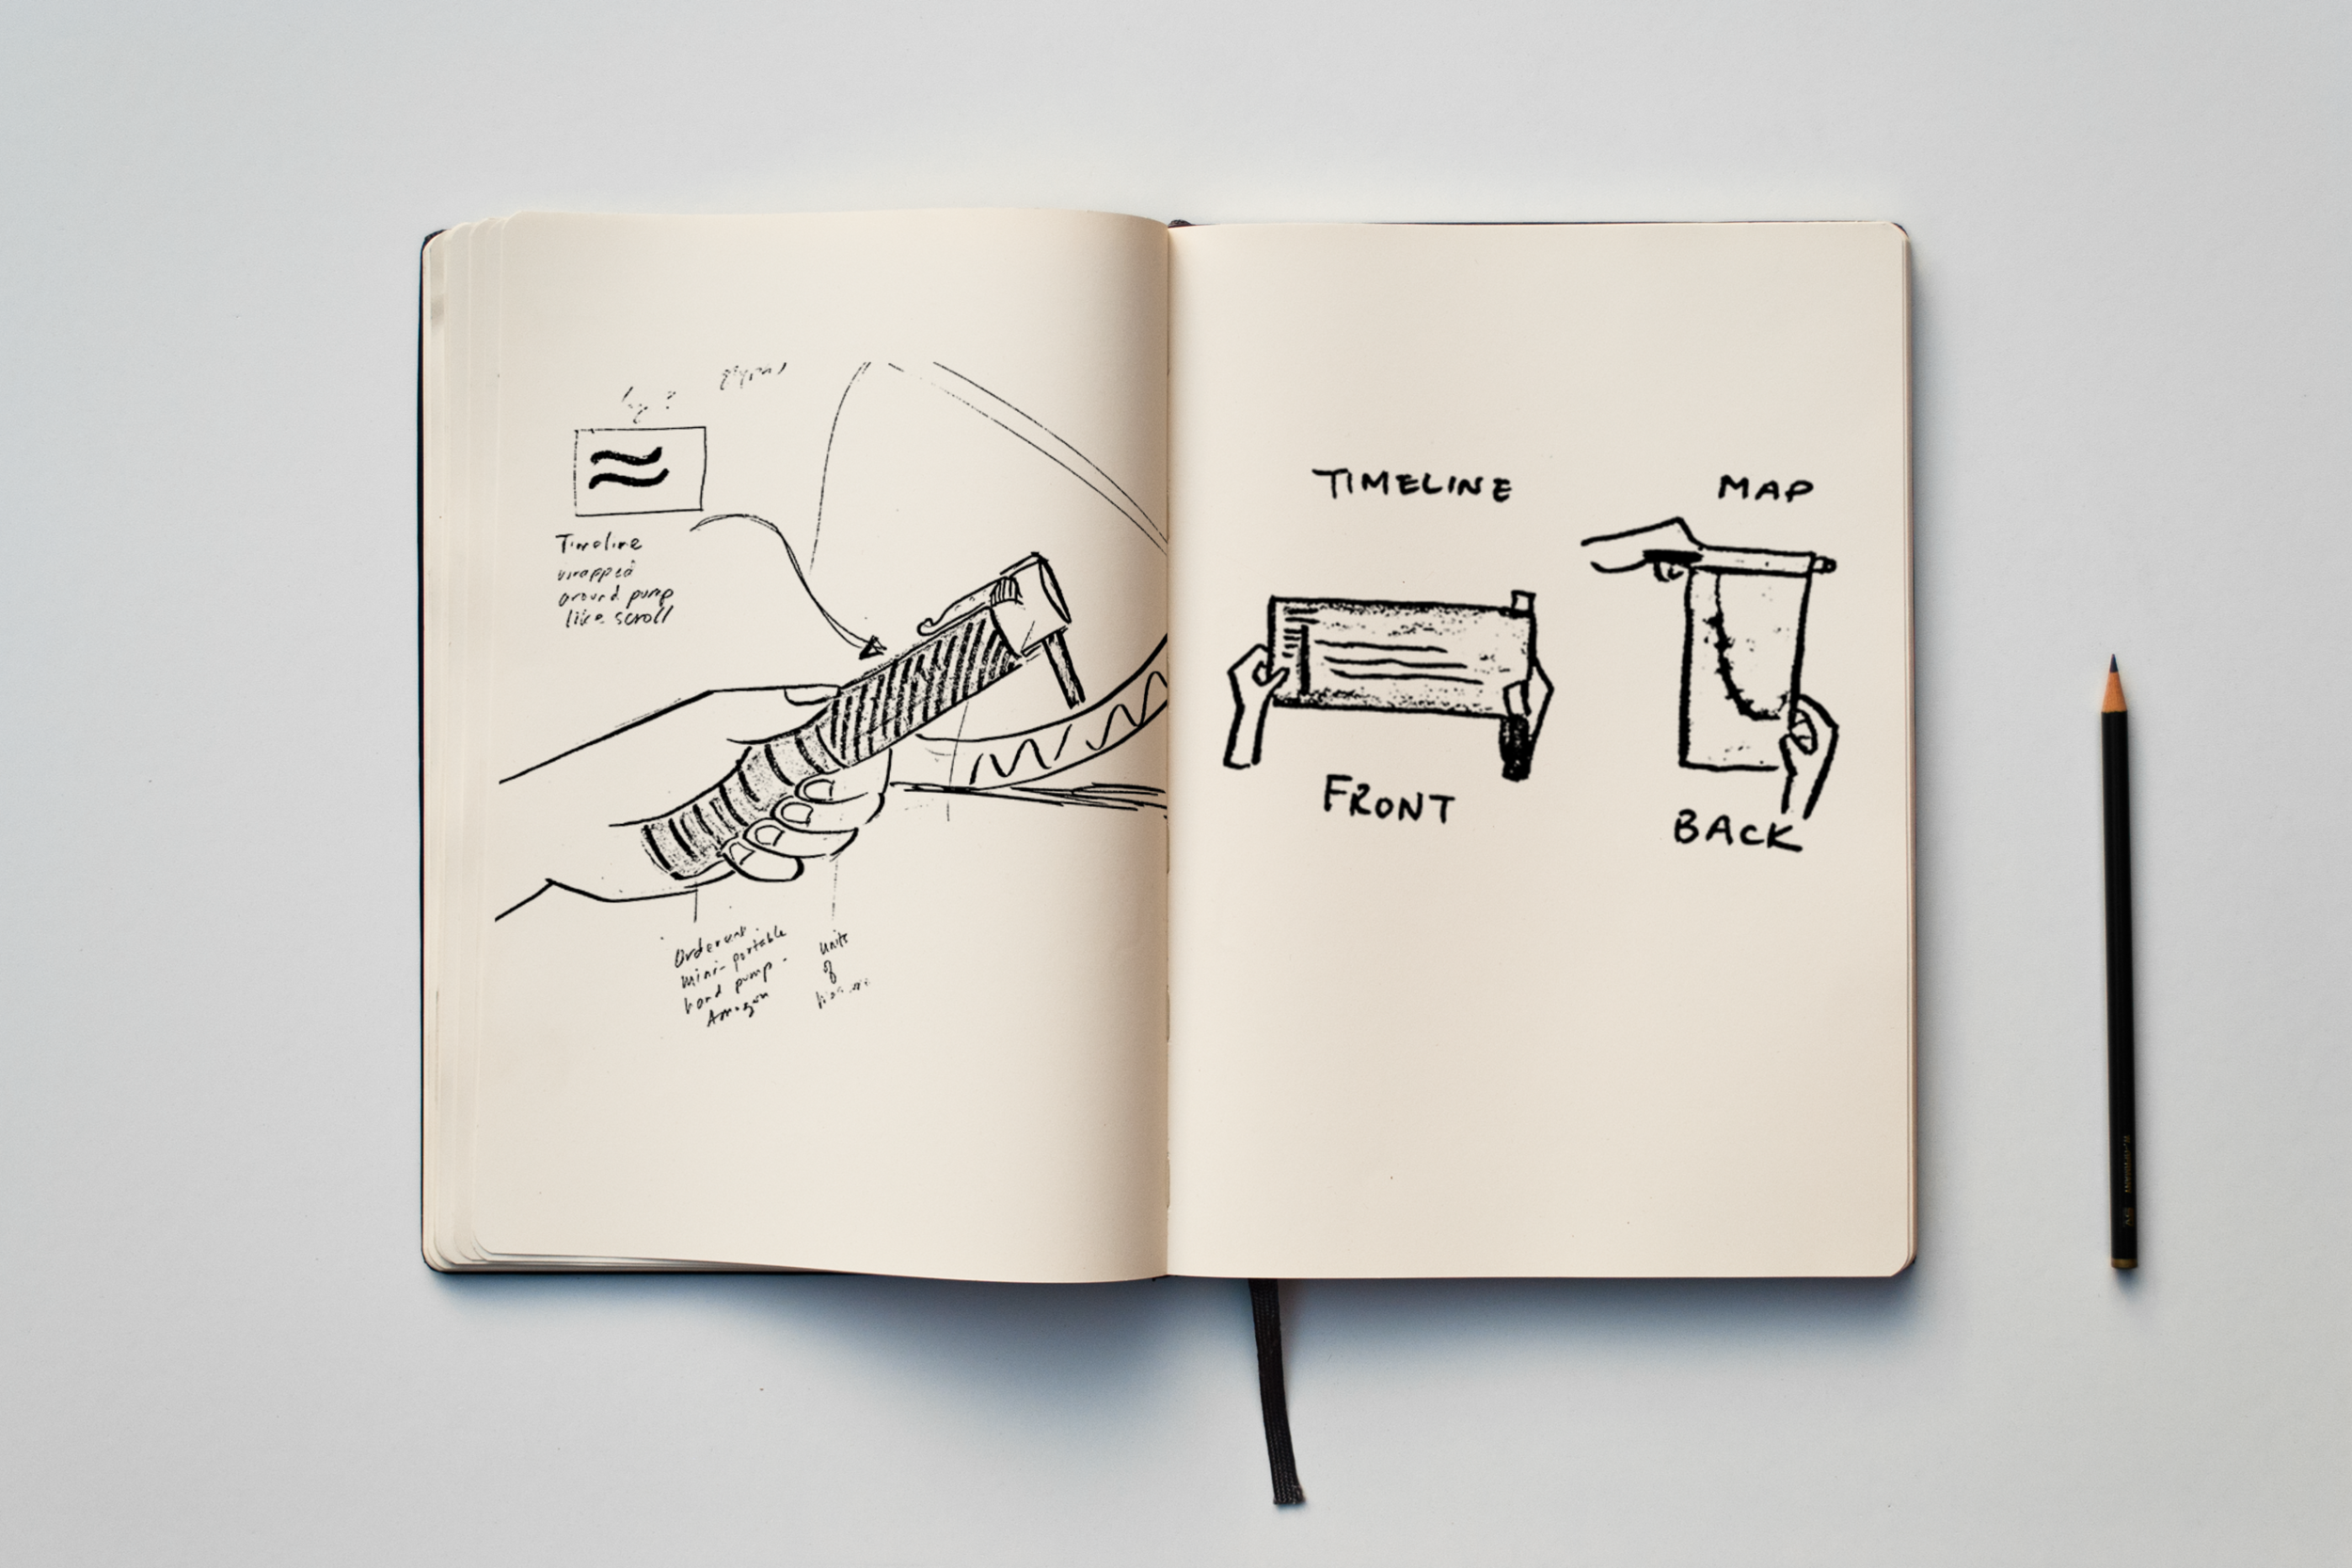
Through the vernacular of cycling, I used a bike pump as a vehicle to present the complex data of a rider’s journey. I created a logo and package using vibrant colors to fuel the design of the story.I learned how graphic design can show the complexity of data in a more attractive and simple way.
•KEYWORDS energetic/athletic/scientific